
01 / 06
Can it be used without a GIS specialist?
Yes. Analyses run through ready workflows and results are explained in plain language. Specialist departments can adjust the criteria in detail.

Platform
MD Atlas
MD Atlas brings satellite imagery, terrain data and your institution’s records together in one workspace. It prepares slope, flood, population and accessibility analyses and turns the results into reports and map sheets.
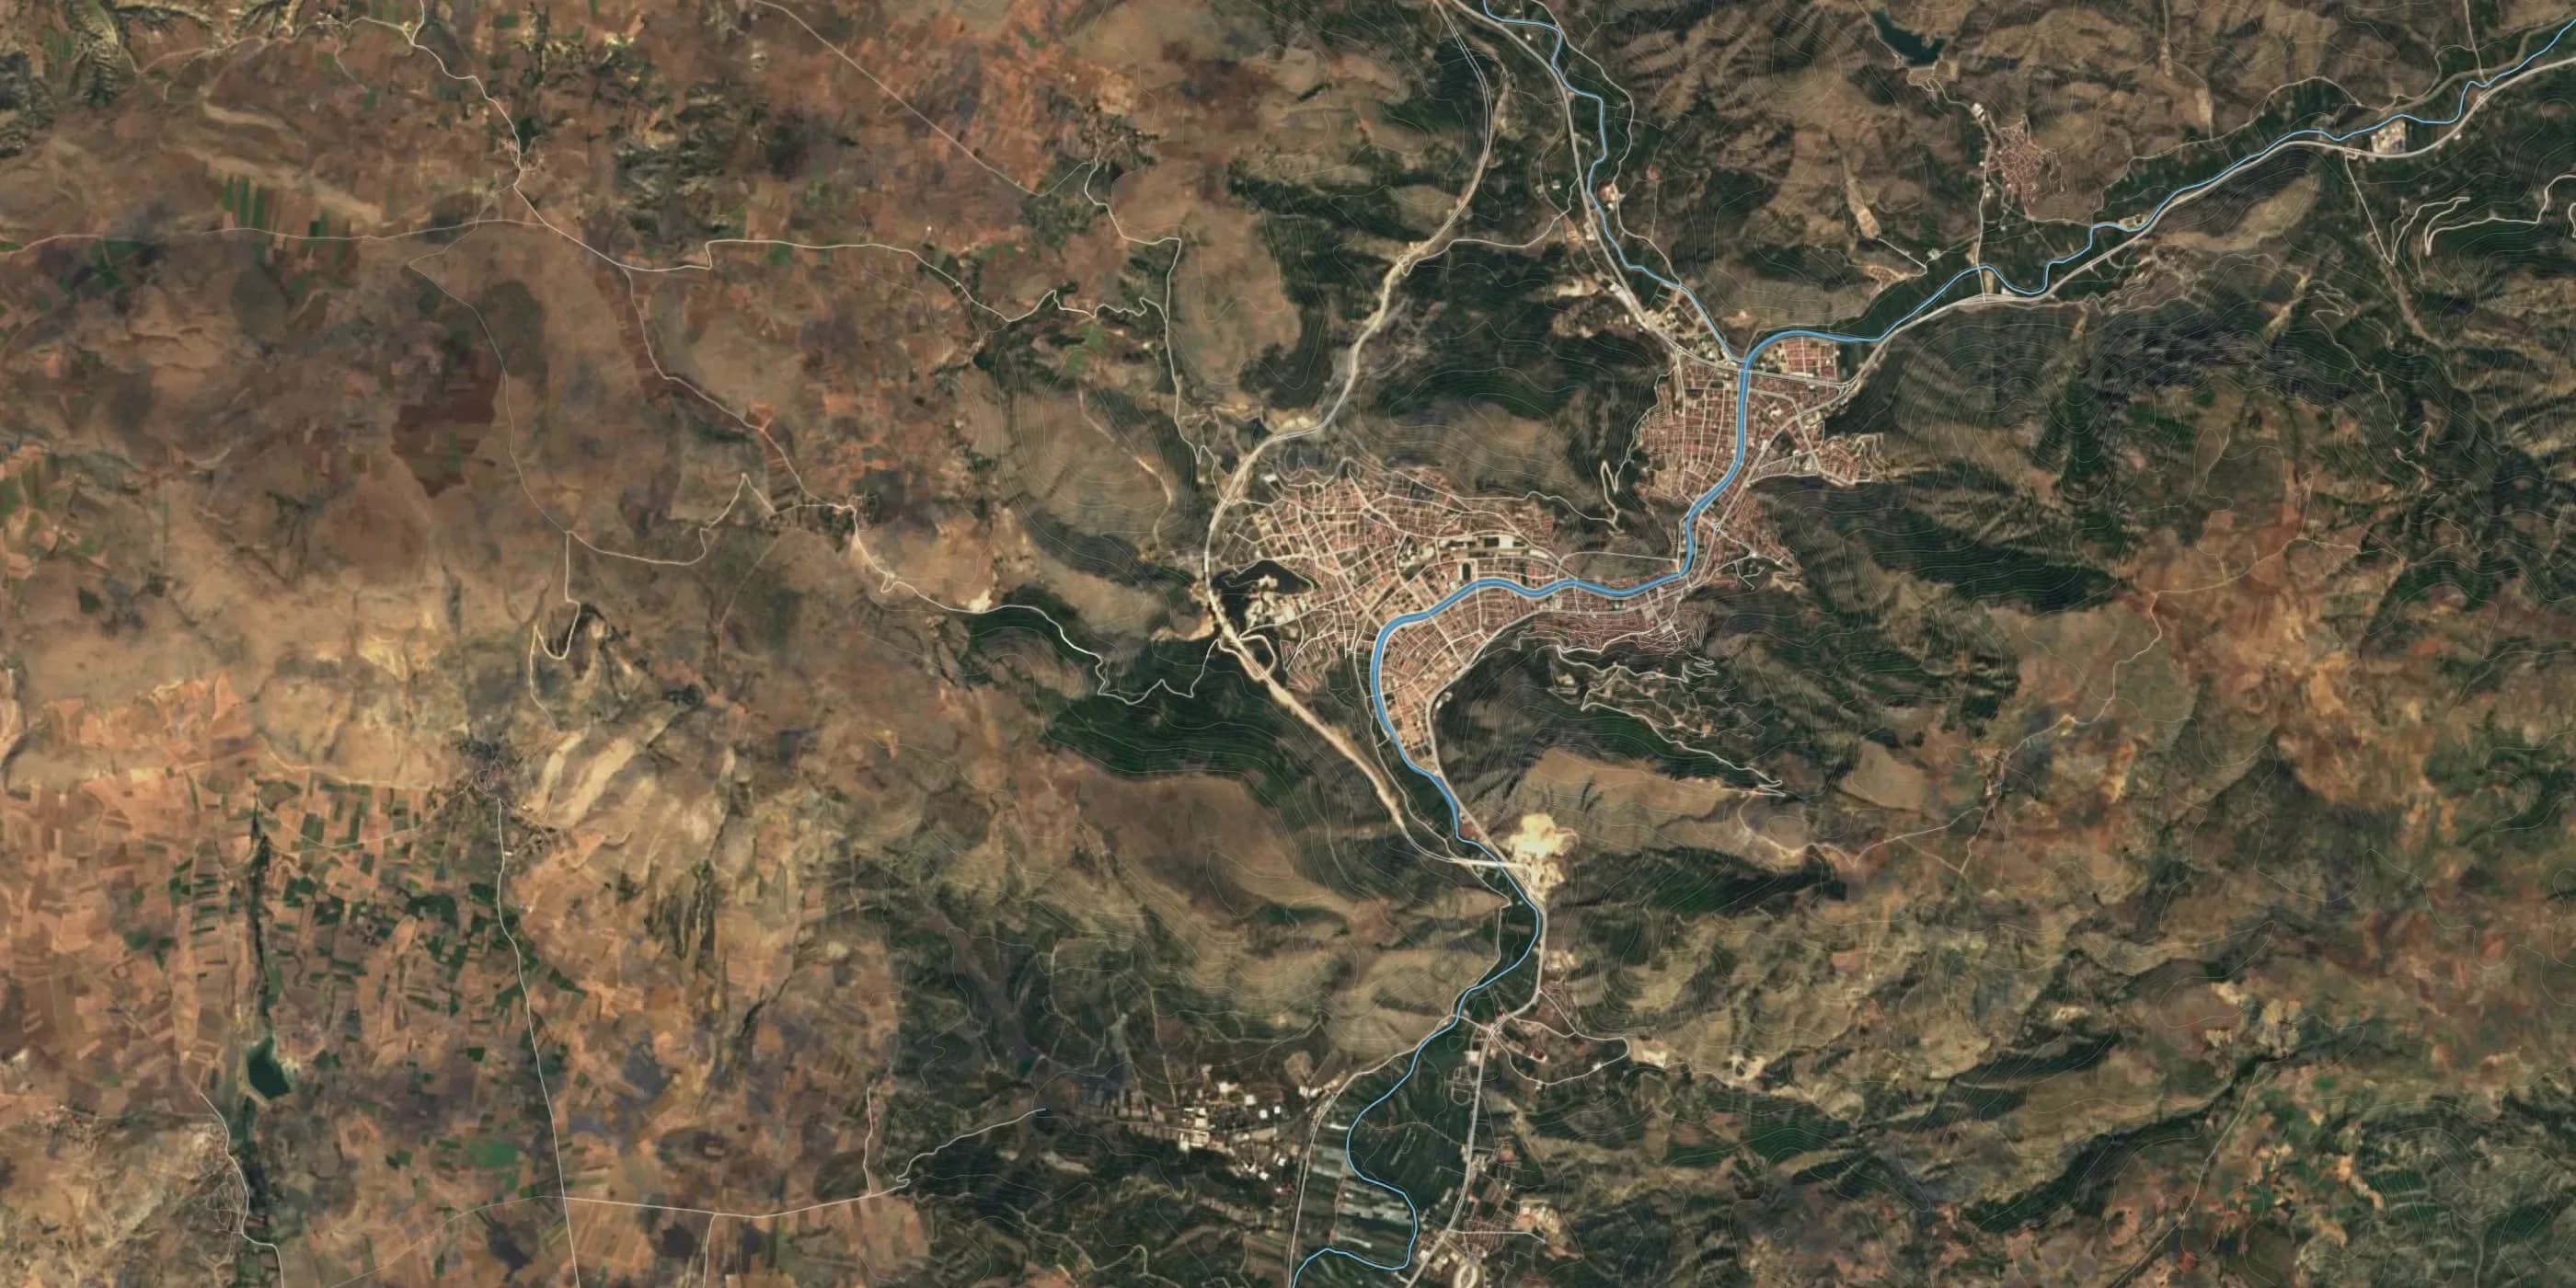

Analysis shown
Flood area
Imagery: Sentinel-2 cloudless 2016, EOX (contains Copernicus data) · Map data © OpenStreetMap contributors
Satellite imagery, the elevation model and base layers are ready on the platform. Your institution adds its own records, and analyses are prepared on this shared base.
Data transfer
Existing records are uploaded as spreadsheets, drawings or GIS layers.
Matching and checks
Records are matched to locations; missing and faulty data is reported.
Analysis
The analyses you need are prepared on the same base.
Reporting
Results go into reports and map sheets together with their sources.
The analyses needed to see the city as it is today, identify risks in advance and support planning decisions run on one platform.
Let’s define the analysis scope for your institution
In a short meeting we review which analyses your current data supports and what additional data is needed.
MD AI turns the question into the analysis steps it needs, states the data used and presents the result on a map.
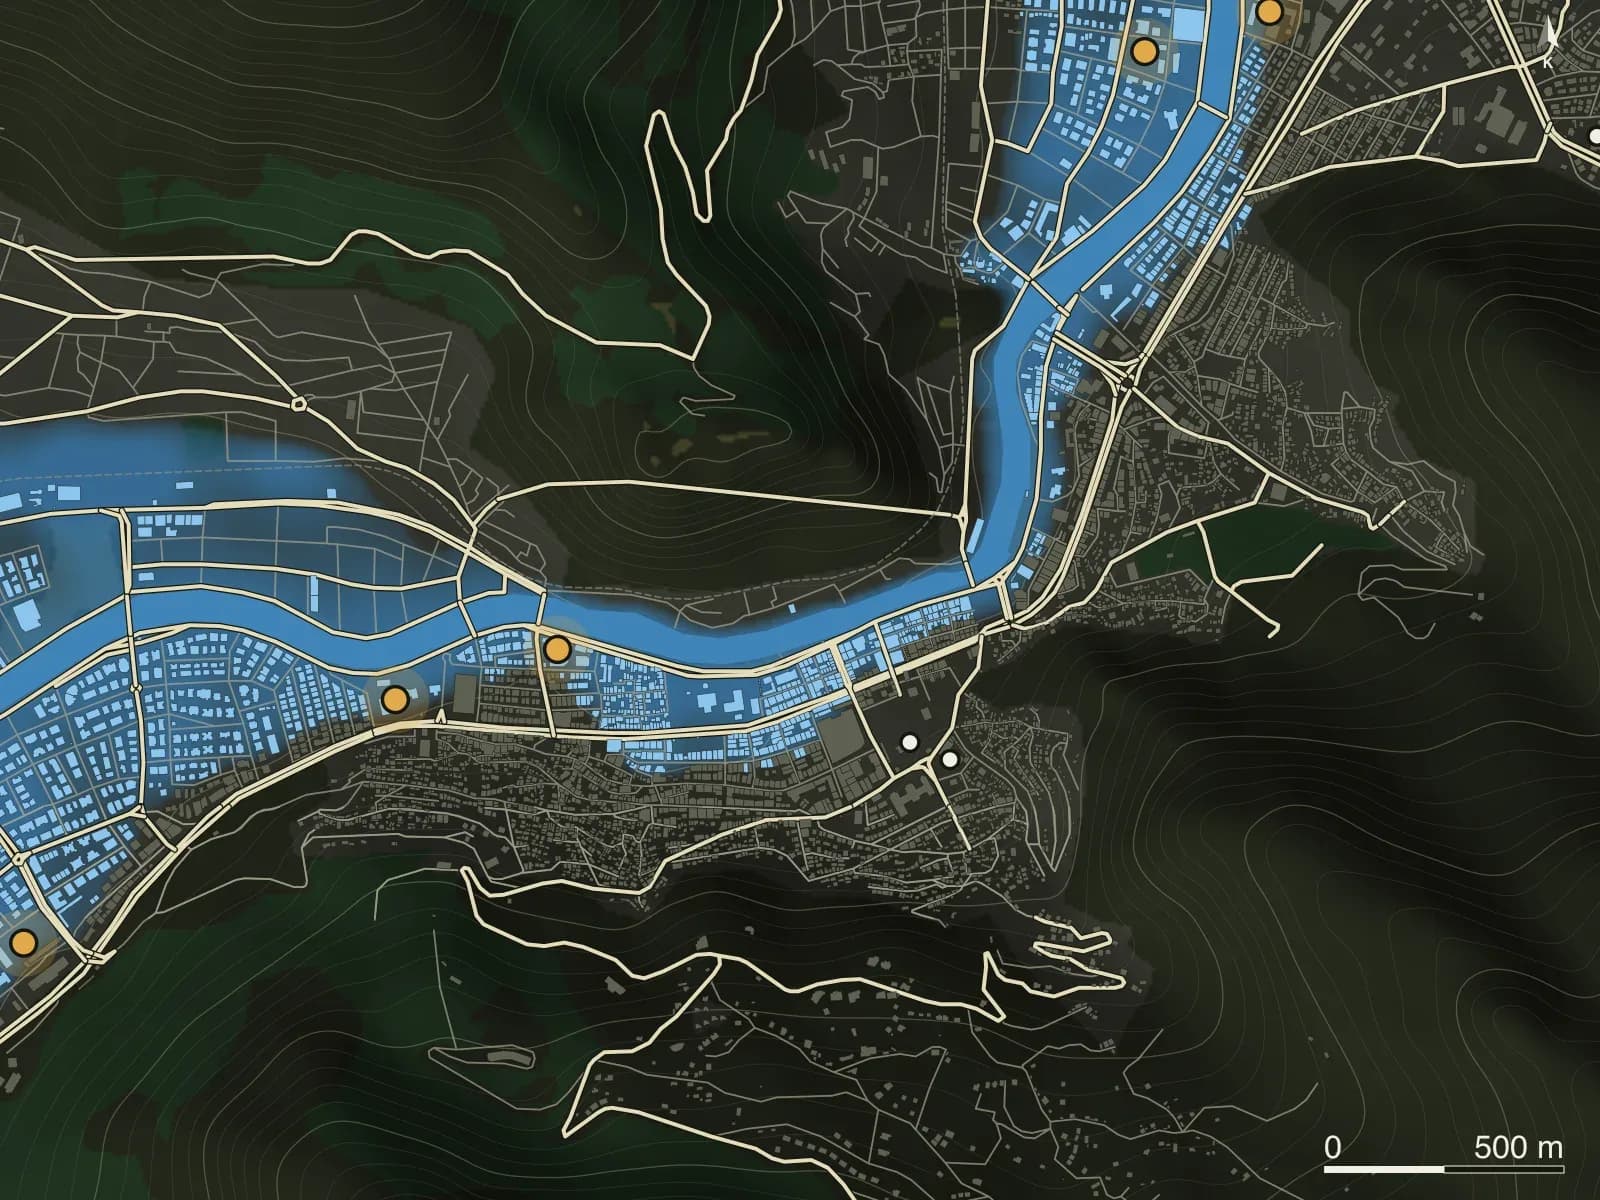
Which schools are inside the flood area?
Analyses prepared
Data used
Result
Schools inside the flood area are marked on the map, each with its nearest safe assembly area.
Priority schools for evacuation and drills become clear, and school retrofit budgets go where they are needed.
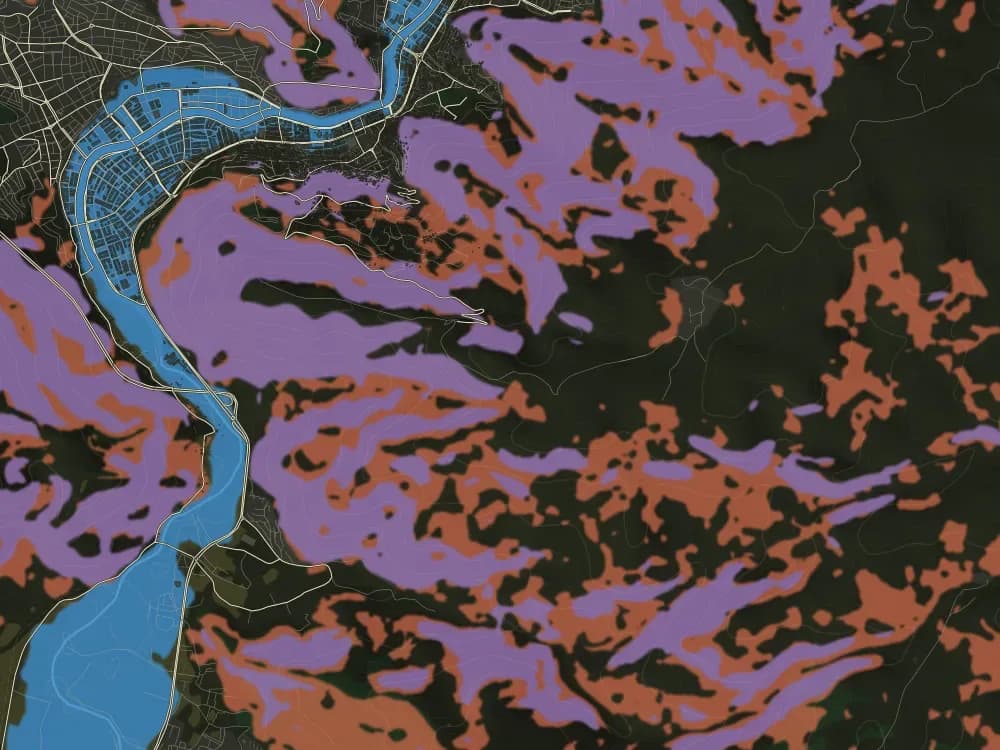
Topography, areas exposed to flooding, landslides and wildfire, vegetation and farmland, existing built-up areas, transport and protected areas are assessed as separate layers. The settlement suitability map combines these six layers and shows how suitable each area is for building.
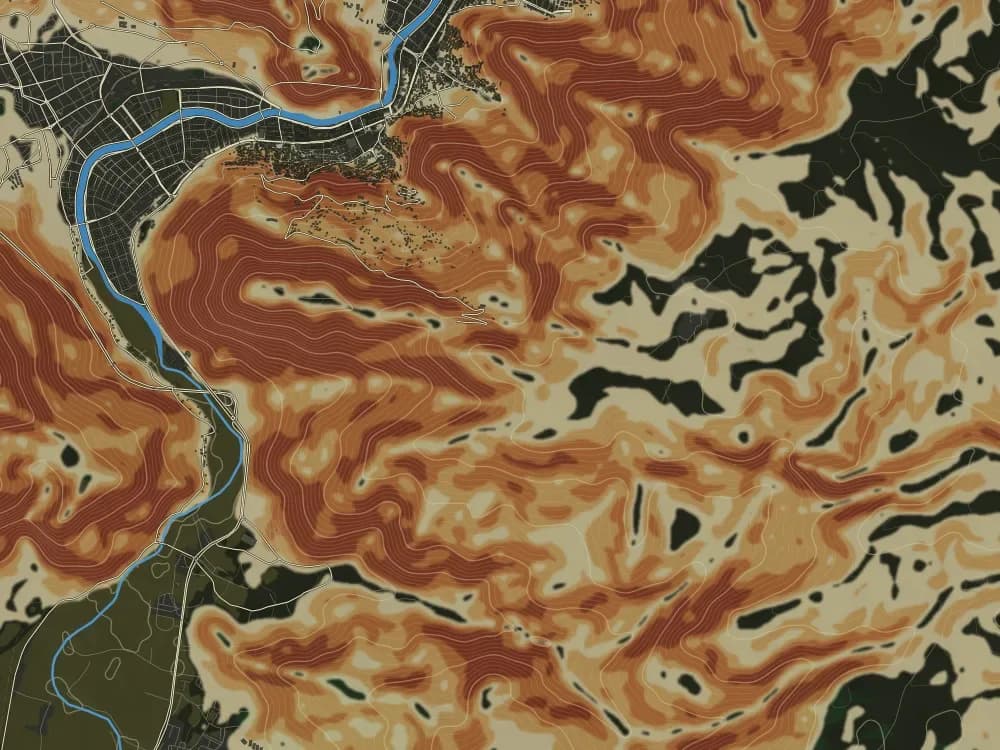
1Topography
2Hazard zones
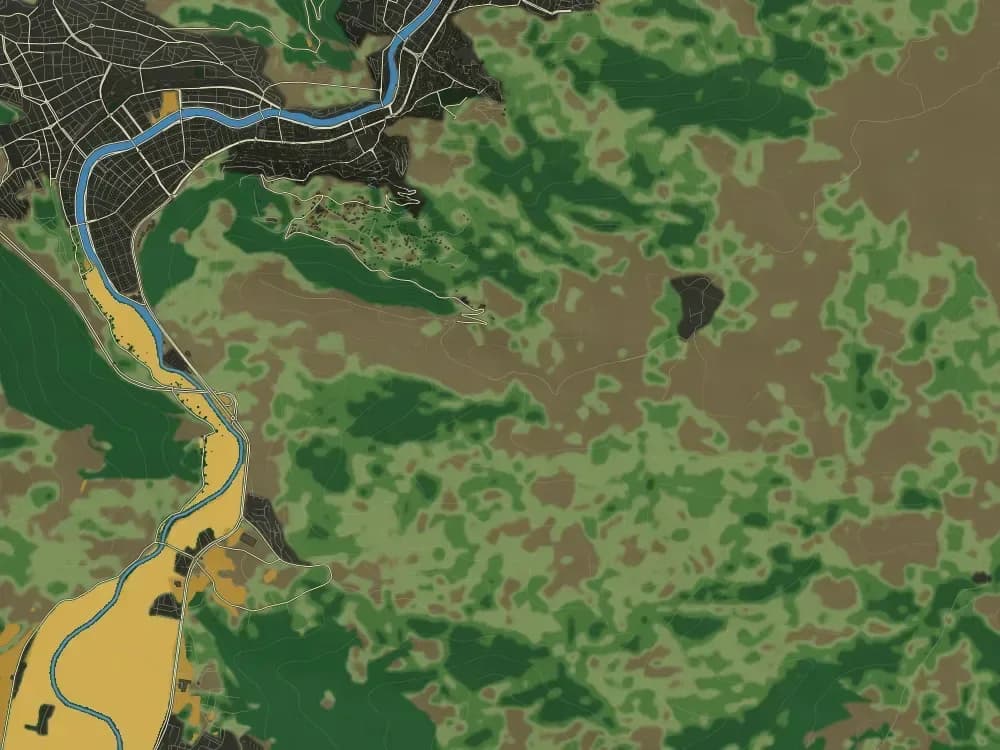
3Vegetation and farmland
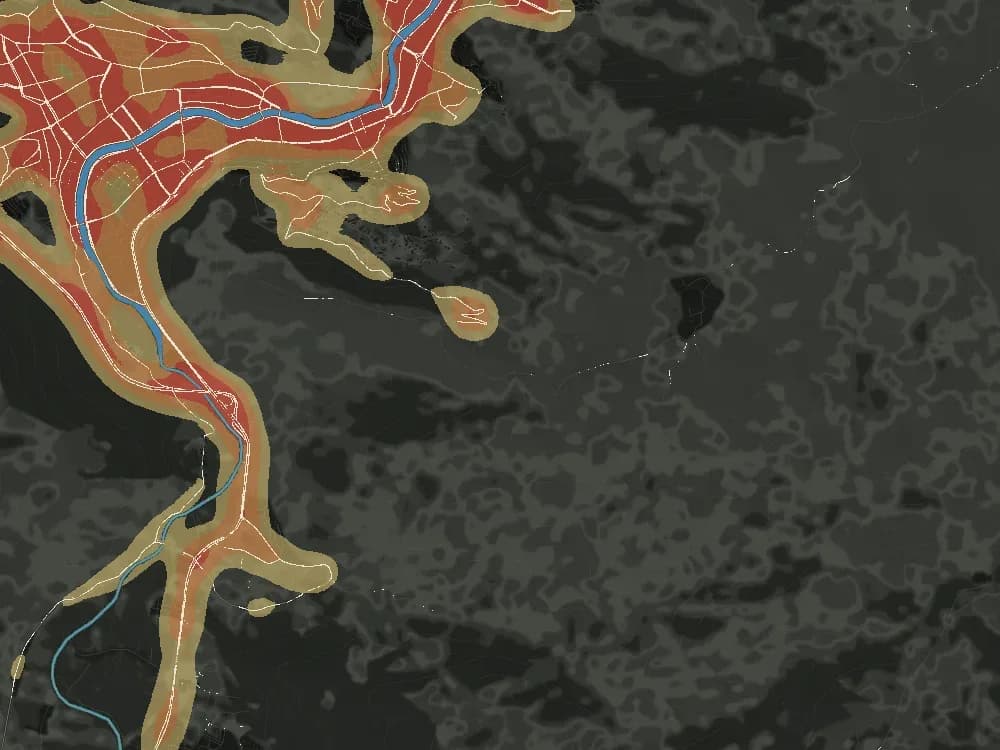
4Built-up and residential areas
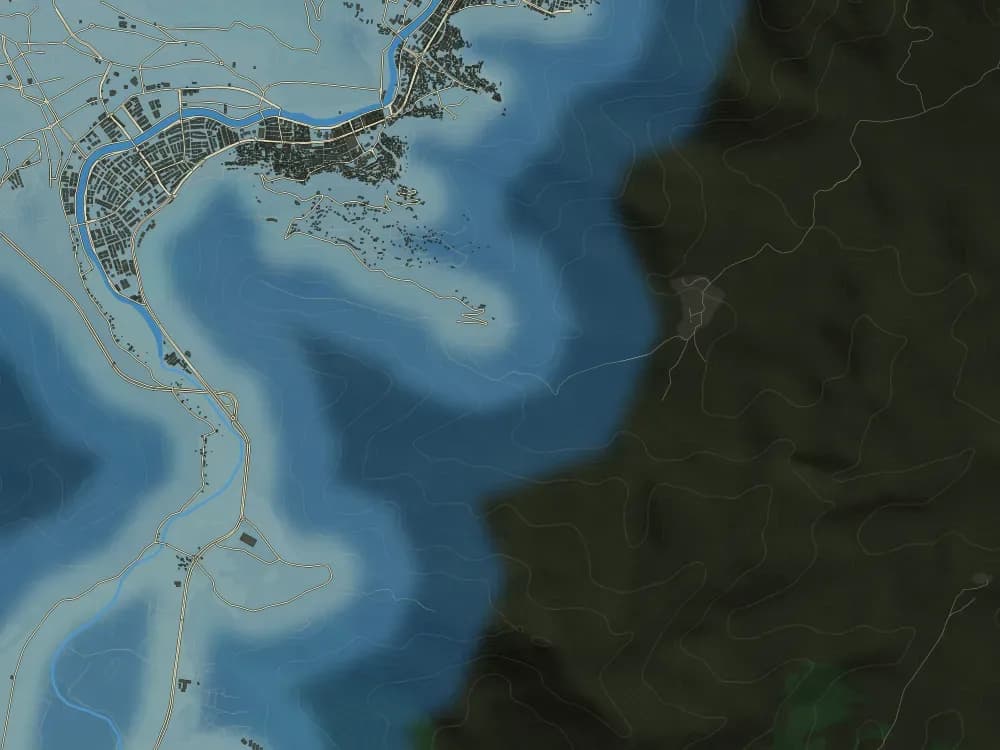
5Transport and infrastructure
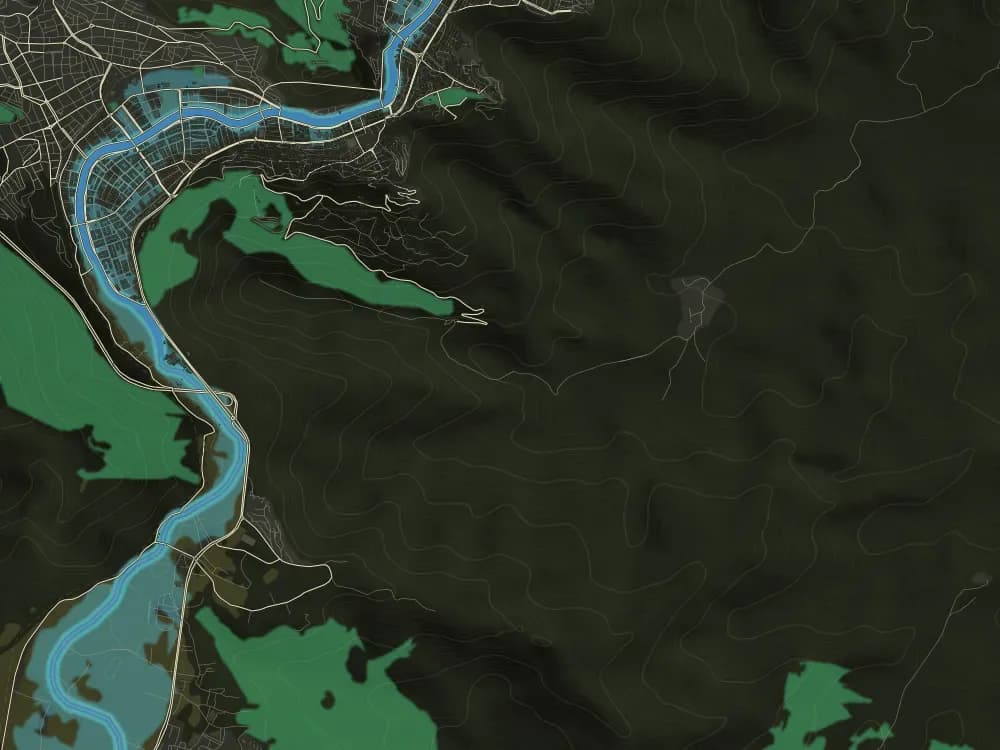
6Protected areas
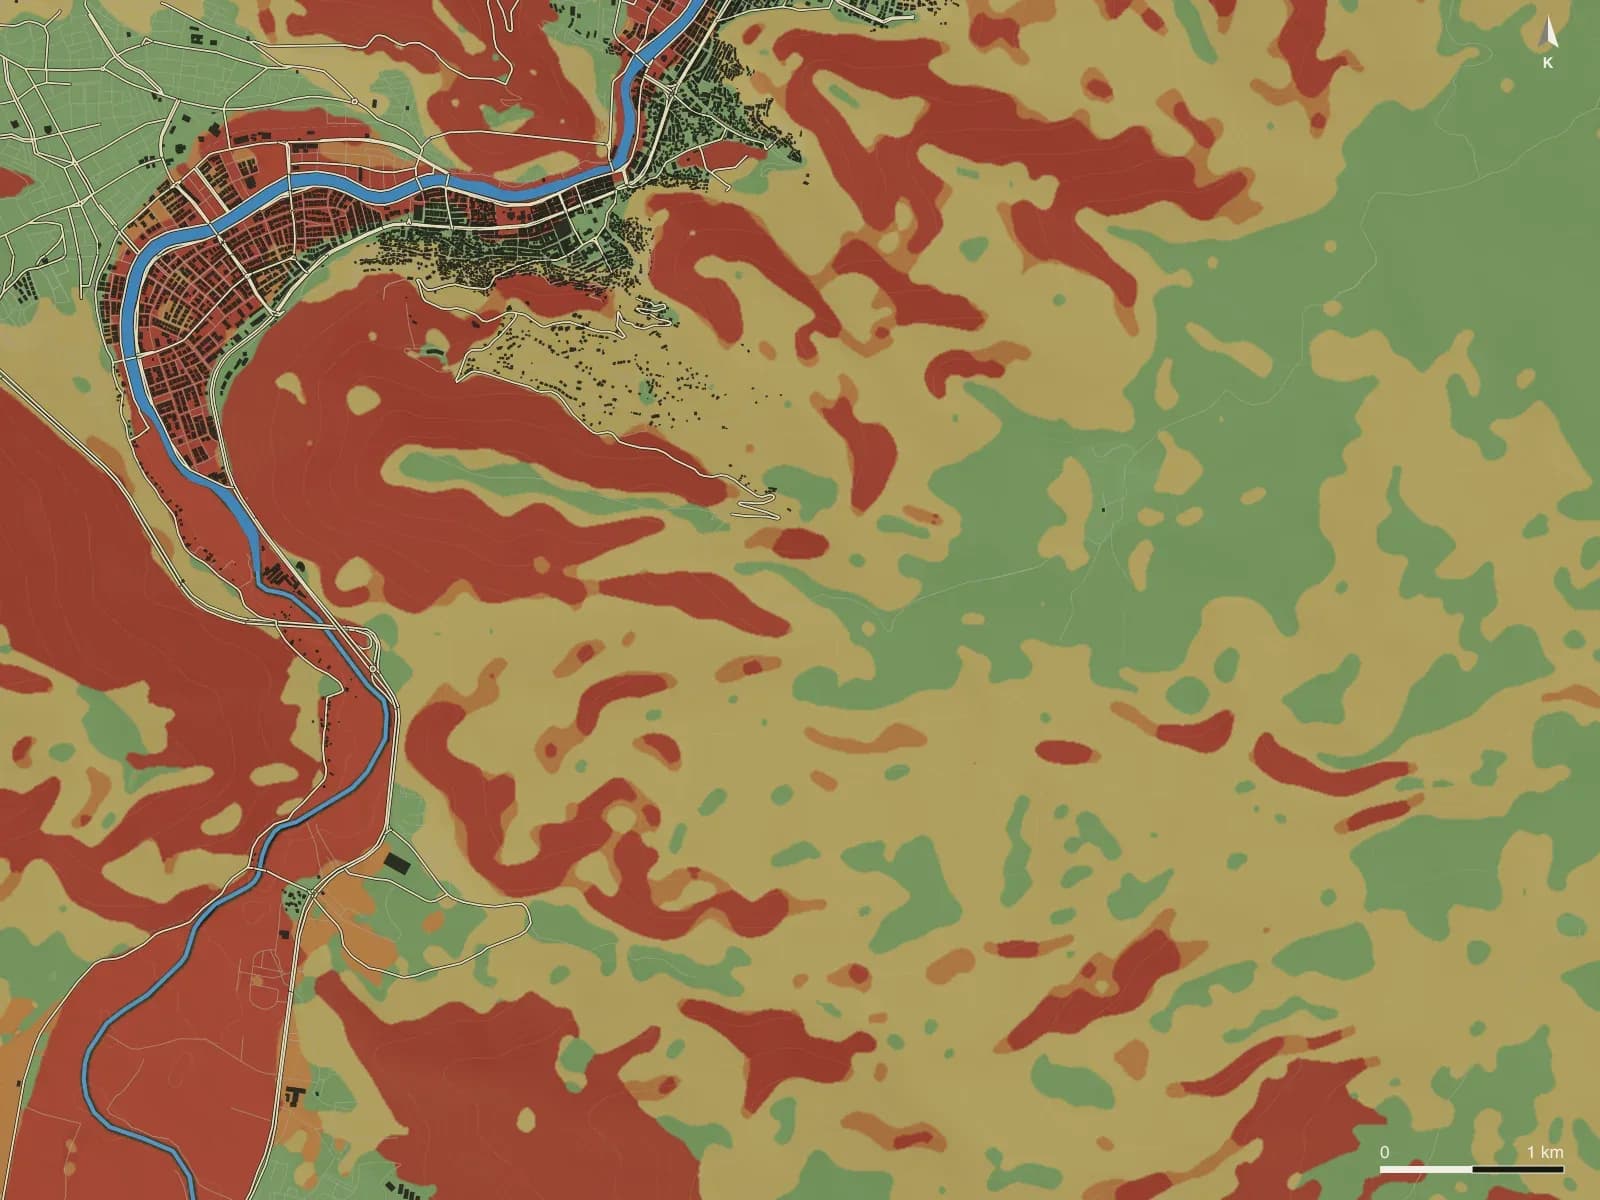
Suitable
%27No known constraint for building.
Suitable with precautions
%37Building is possible with precautions.
Detailed survey required
%4A detailed ground survey is needed before deciding.
Not suitable
%32Closed to building due to flooding, steep slopes, farmland or protection.
Sample study area, prepared with real satellite, terrain and road data.
With this map
Choosing new settlement areas
Housing and facilities are planned in the least risky areas.
Justifying plan decisions
Zoning plan changes are explained with data.
Prioritising survey budgets
Detailed ground surveys are commissioned only where needed.
Preventing building in risky areas
Warnings appear before permits are issued in flood and landslide areas.
Analysis results are applied to every building. Structures in flood areas, on steep slopes or in wildfire-prone areas are shown and listed one by one.
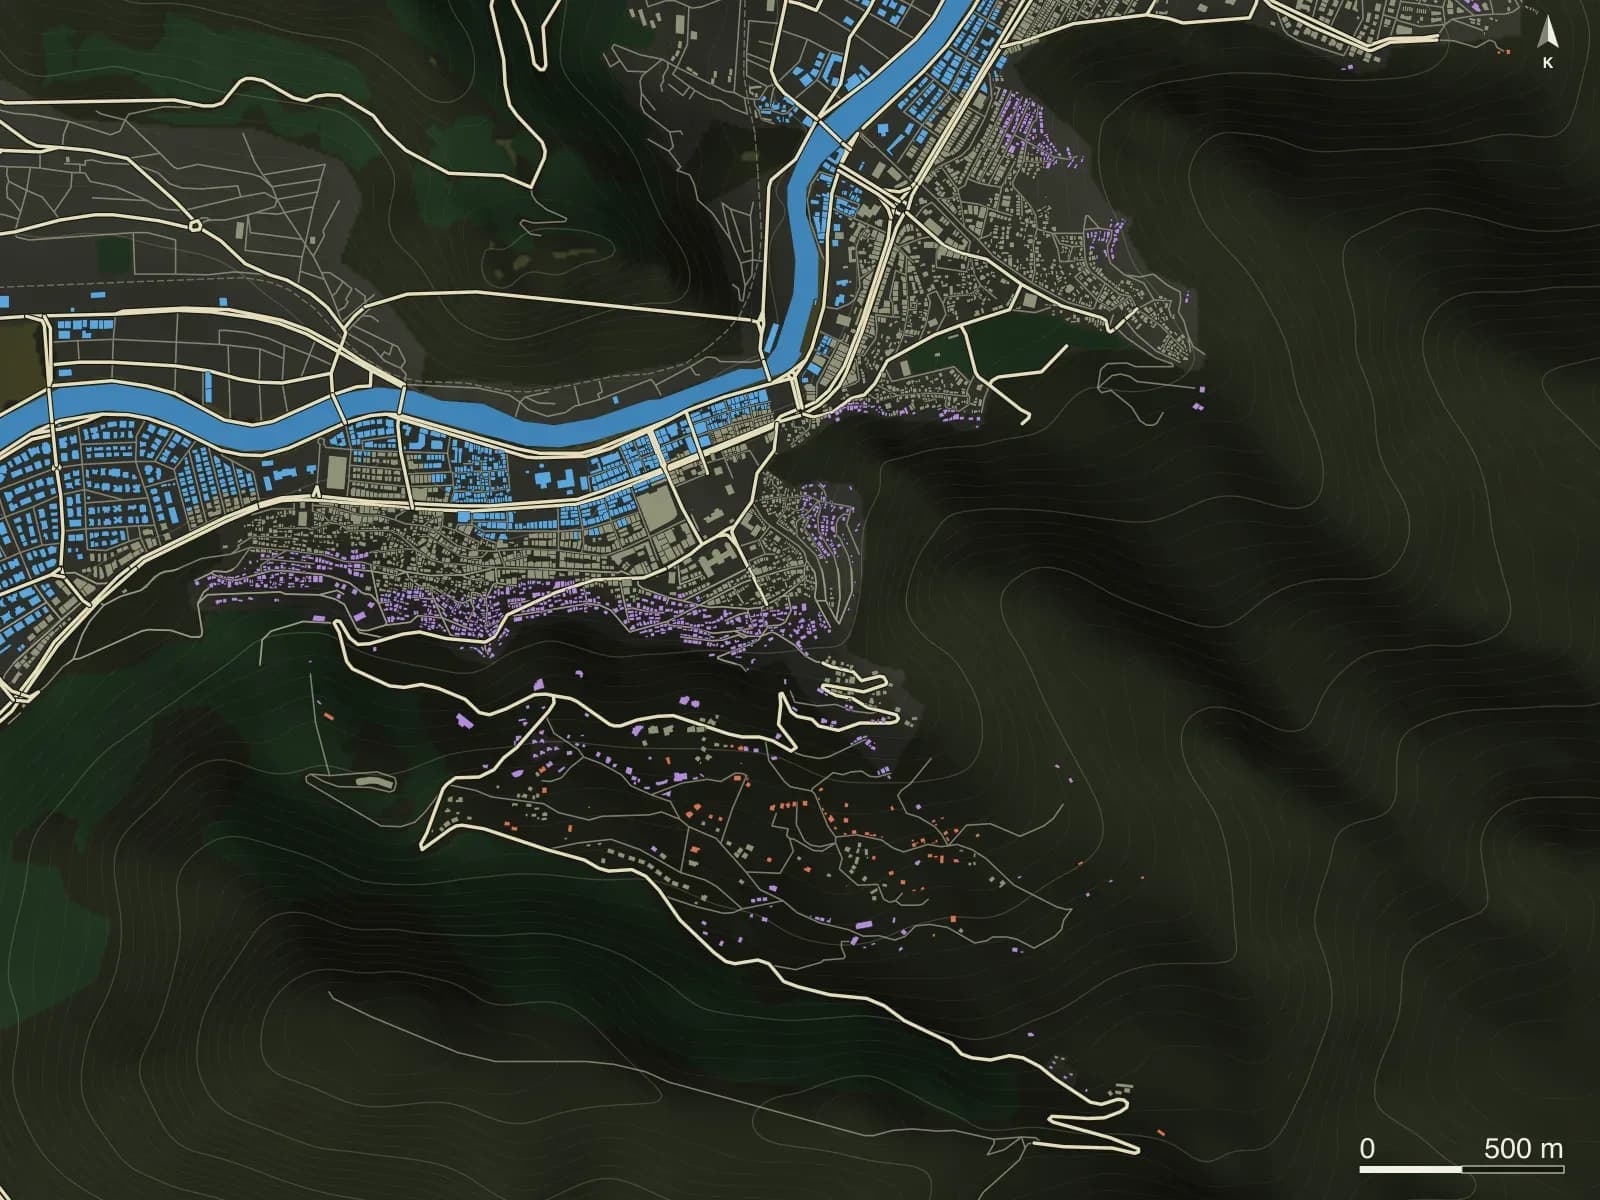
With this inventory
Urban renewal priority
The renewal programme starts with the riskiest buildings.
Evacuation planning
Buildings to evacuate first are known in advance.
Building inspection
Inspection teams are directed to risky areas.
Events such as a river flooding or bridges closing are simulated on the map. Use the slider to compare normal conditions with the scenario; areas whose access gets longer stand out.
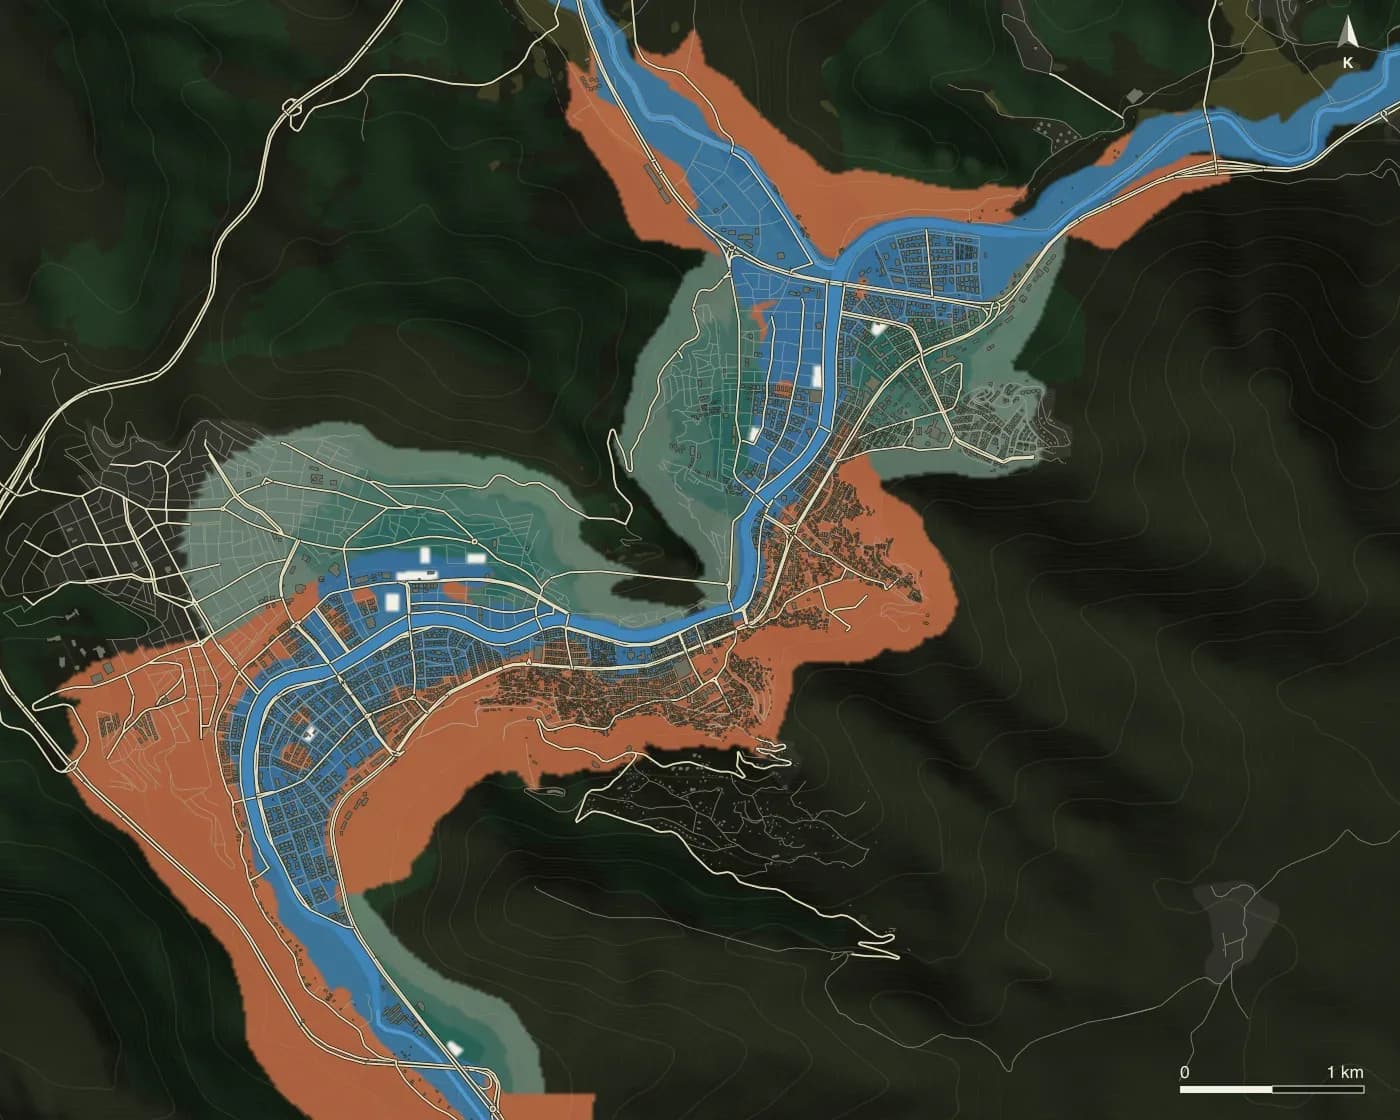
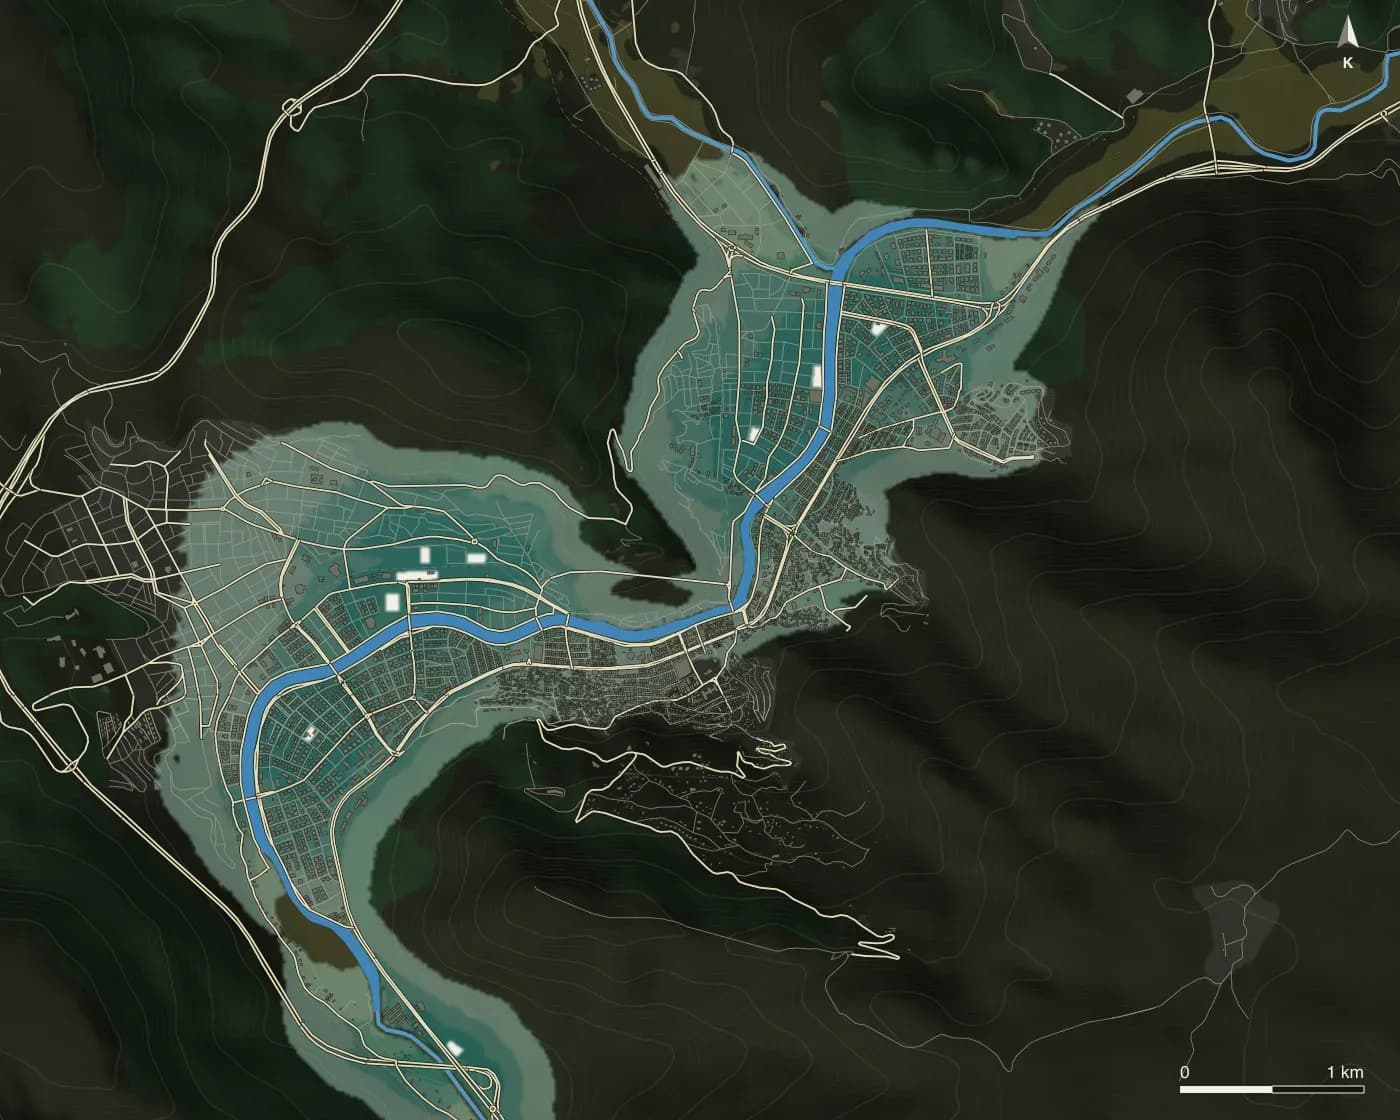
What the scenario shows
Cut-off neighbourhoods
You see which areas lose their link to an assembly area during a flood.
Critical bridges and roads
The links that affect the most people when closed are identified.
Temporary assembly needs
Temporary assembly and shelter sites are planned for areas with longer access.
Population size and age distribution 25 and 50 years ahead are projected at neighbourhood scale, so school, health and infrastructure needs can be planned.
Education
How school-age population changes by neighbourhood.
Health and care
Where the older population will concentrate.
Infrastructure
Changes in water, transport and housing demand.
Illustrative age structure; values are calculated from the institution’s data.
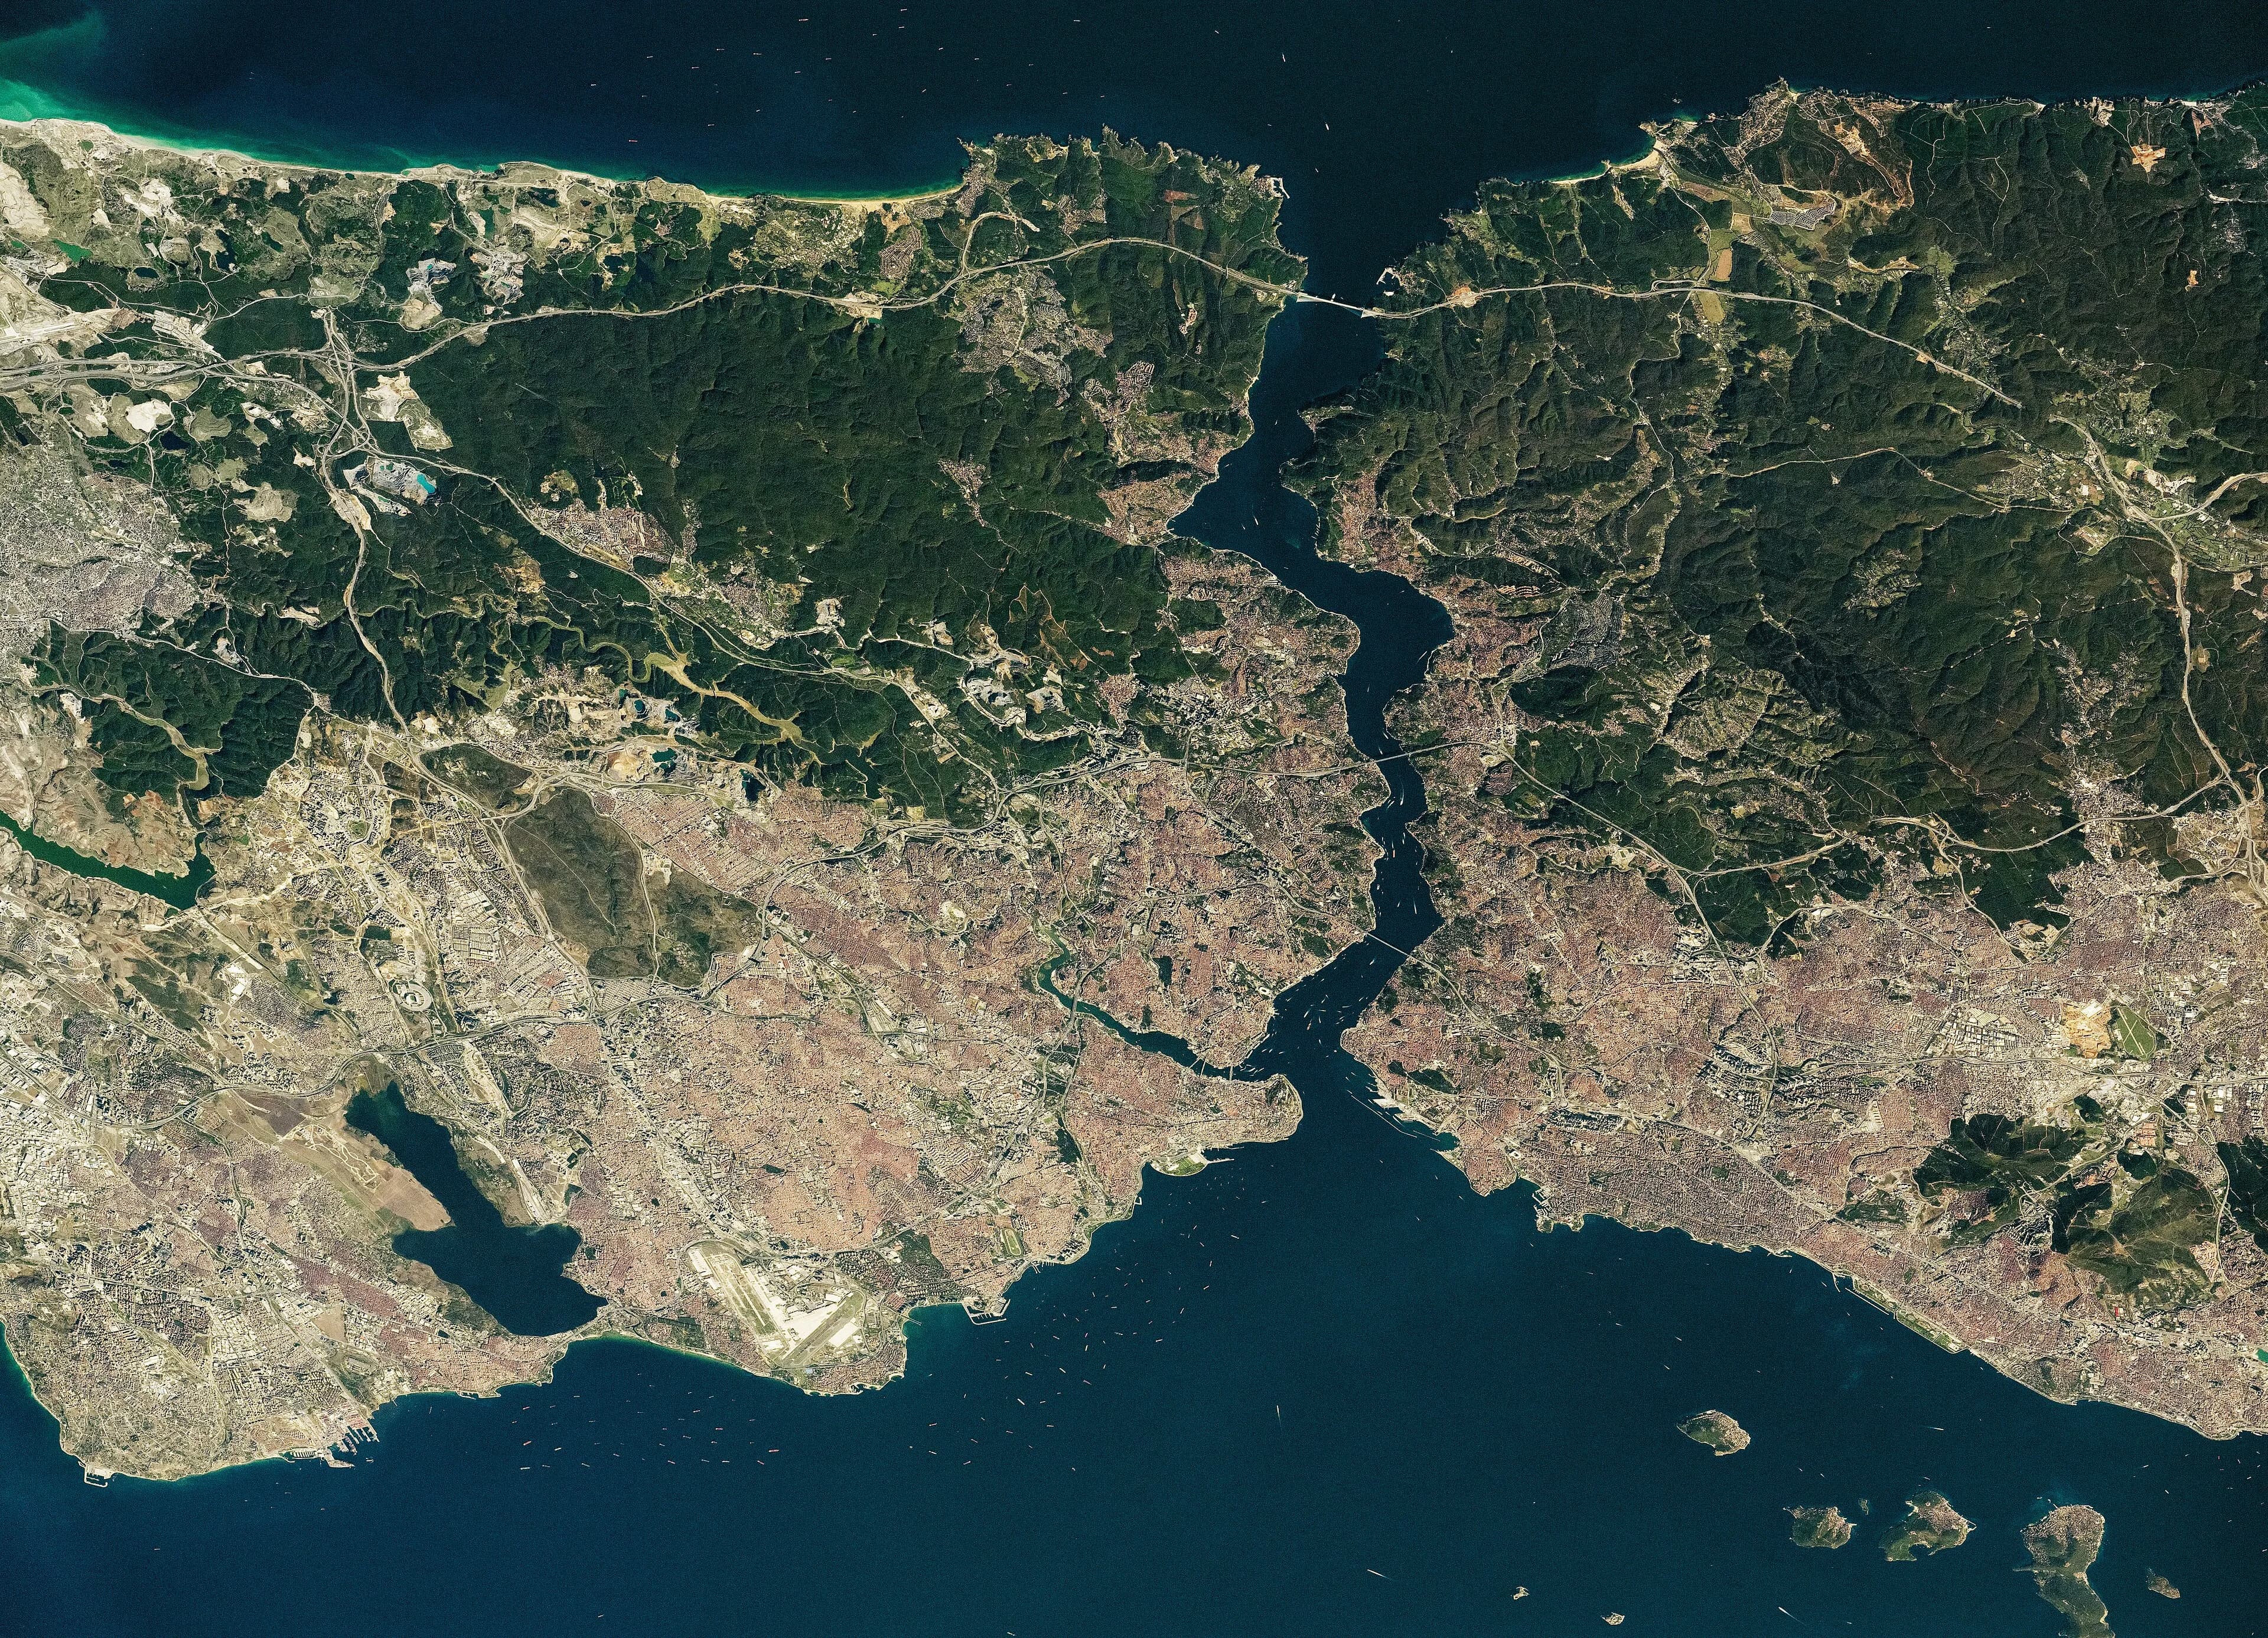
Analyses are prepared on current satellite imagery of the area. Open imagery is refreshed regularly; high-resolution imagery is obtained when building-level detail is needed.
High resolution
For work that needs building-level detail.
Regular updates
Open imagery is updated at regular intervals.
Archive comparison
Urban growth and land change over the years.
Multi-band imagery
Vegetation, water surfaces and surface temperature.
Photo: NASA
Results become map sheets for official correspondence, reports for decision-making and pages that can be shared with the public.
Analysis report
Findings, tables and maps in one document.
Map sheet
Print-ready map with legend, scale and north arrow.
Shared board
Departments work on the same current map.
Public page
Selected layers are shared with citizens.
MD Atlas serves different departments on the same data.
Can’t find your question? Write to us →
Share your boundaries and existing data, and we review sample analyses for your area together.
How it works
Workspace
A dedicated, login-based workspace is opened for your institution.
Data transfer
Existing layers are uploaded and missing data identified.
First analyses
The first reports and map sheets are prepared on priority topics.