

Open satellite data in urban analysis: what can be monitored with Sentinel and Landsat
Monitoring built-up area, green space, surface temperature, water bodies and burned areas at city scale with Copernicus Sentinel and Landsat imagery; resolution, revisit frequency, data policy and limitations.
- Satellite
- Copernicus
- Landsat
IN SHORT
- 01Sentinel-2 images are acquired at a resolution of up to 10 metres, every five days with two satellites, while Landsat 8 and 9 images are acquired at 30-metre resolution, together roughly every eight days.
- 02Copernicus Sentinel data is free and openly accessible; the USGS likewise treats Landsat data as public domain and requires no permission for use.
- 03Cloud cover, pixel size and the need for ground truthing are the fundamental limitations that determine how open satellite data can be used in urban decisions.
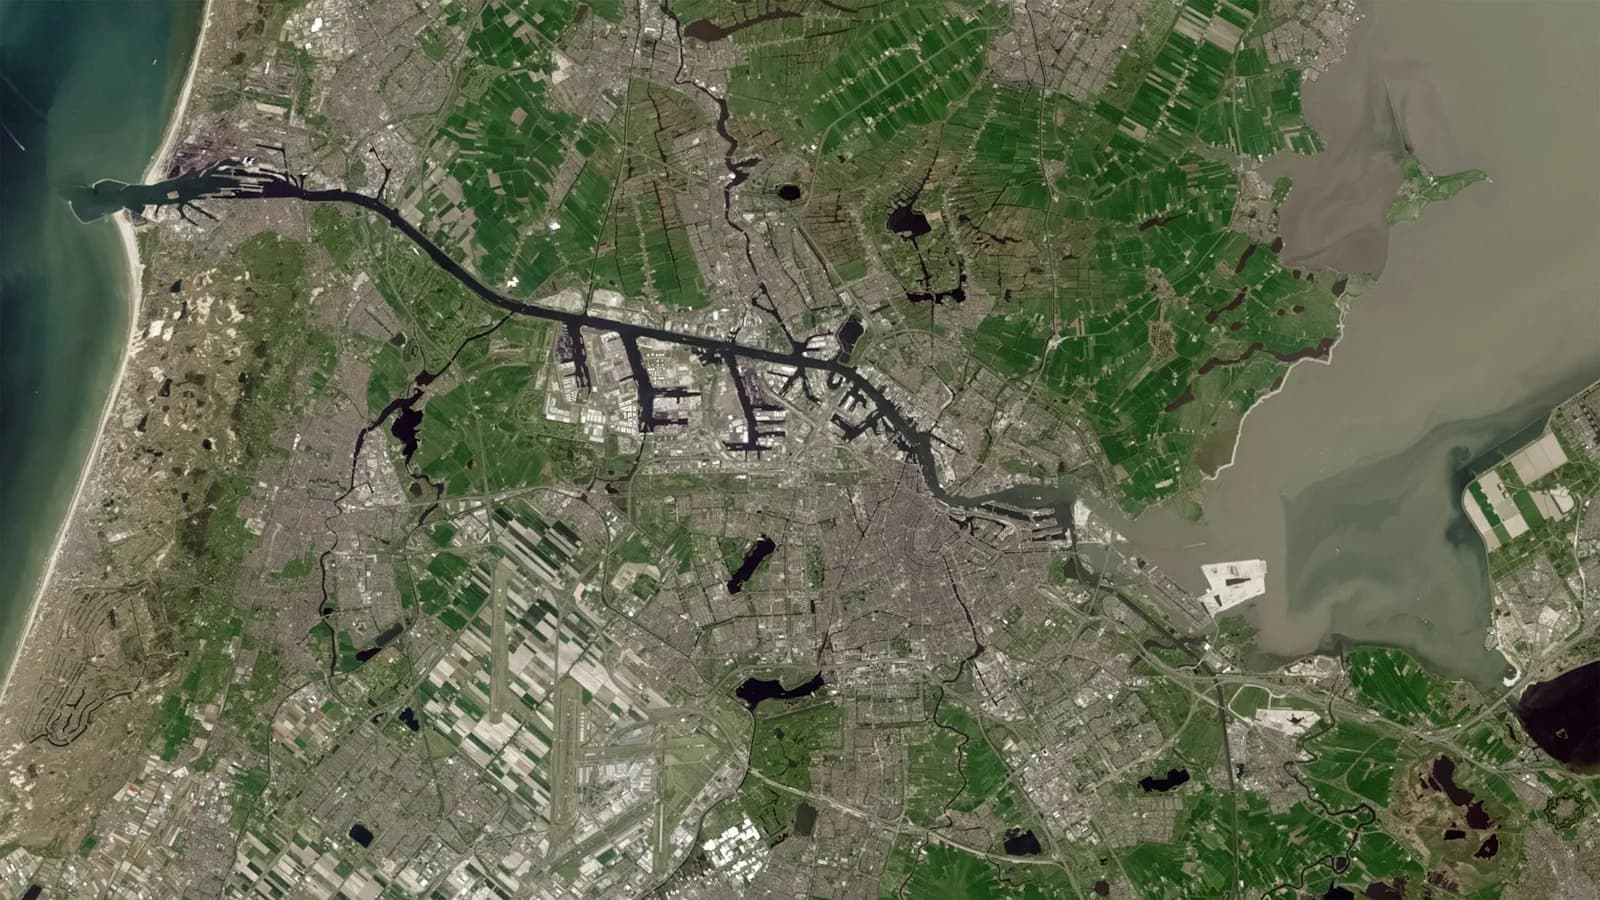
The European Union's Copernicus programme and the United States' Landsat programme provide, free of charge, data obtained from satellites that image the entire world at regular intervals. This data allows municipalities and public institutions to monitor change within their own boundaries over the years using the same method.
This article summarises which subjects can be monitored at city scale with open satellite data, the resolution and revisit frequency of the images, the data policy, and the limitations to bear in mind when using the results in decision-making processes.
Open-access satellite programmes and data policy
Data from the Copernicus programme's Sentinel satellites is distributed on a free and open-access basis. The Copernicus Data Space Ecosystem, the programme's current access platform, states that it provides free access to the data and services of the Sentinel missions and describes the free and open data policy as a cornerstone of the programme. Institutions, researchers, the private sector and individuals can all access the same data.
Landsat data is distributed by the United States Geological Survey (USGS). The USGS states that Landsat 9 data and products can be downloaded free of charge; it also explains that it treats Landsat data as an official public-domain record, that no permission is required for use, and that it asks only that USGS be credited as the source.
An important aspect of these programmes for institutions is archive depth. Sentinel-1A was launched in 2014 and Sentinel-2A in 2015, so the Sentinel archive covers a period of more than ten years. The Landsat archive goes back further still: the USGS's surface temperature product includes images for Landsat 4 starting from 1982. This allows a municipality to compare today's situation with images from past years using the same data source, and to document long-term change.
Resolution and revisit frequency
A satellite's suitability for urban analysis depends on its resolution, which determines the smallest distinguishable area, and on how often it images the same location. The values given on the official mission pages of the three main data sources are as follows:
METHOD NOTE
- Sentinel-2
- An optical sensor; of its 13 bands, four are at 10-metre, six at 20-metre and three at 60-metre resolution. The swath width is 290 kilometres. A single satellite images the same location every 10 days, while a two-satellite configuration does so every 5 days. Sentinel-2C took over from Sentinel-2A in January 2025.
- Sentinel-1
- A C-band synthetic aperture radar (SAR); it acquires imagery independently of weather conditions. In its main mode over land, it provides 5 x 20 metre resolution across a 250-kilometre swath. A single satellite repeats the same orbit every 12 days, and two satellites every 6 days. Sentinel-1C was launched in December 2024 and Sentinel-1D in November 2025.
- Landsat 8 and 9
- The optical bands are at 30-metre, the panchromatic band at 15-metre, and the thermal bands at 100-metre resolution. Each satellite images the same location every 16 days; the 8-day offset between the two satellites means that, together, an image is obtained roughly every 8 days.
Subjects that can be monitored at city scale
Built-up area change: comparing images from different years shows agricultural land, vacant land and the urban fringe being opened up to construction. Pixels of 10 and 30 metres are suitable for monitoring large-scale changes such as a new neighbourhood or industrial area; the addition of a single building, by contrast, is usually indistinguishable at this scale.
Green space: the Normalized Difference Vegetation Index (NDVI) is calculated from the ratio of the near-infrared and red band values and takes a value between -1 and 1. The USGS states that the index is used to measure the density of vegetation and changes in plant health. Loss or increase in parks, groves and agricultural areas can be monitored at neighbourhood scale with this index.
Surface temperature and the urban heat island: the Landsat Collection 2 surface temperature product gives the temperature of the land surface in Kelvin. The USGS lists extreme heat and urban heat island analyses among this product's uses. The product has been produced continuously since 2013 for Landsat 8 and since 2022 for Landsat 9. Unlike air temperature, the value measured is the temperature of the surface; it shows the difference between roofs, asphalt and green space.
Water bodies and flooding: because radar imagery can be acquired through cloud cover, it is used to identify areas flooded after a flood event. The United Nations UN-SPIDER programme states that SAR imagery can be processed quickly for flood mapping and provides relief organisations with near-real-time information.
Burned areas: the Normalized Burn Ratio (NBR) is calculated from the ratio of the near-infrared and short-wave infrared bands. According to the USGS, this ratio is used to identify burned areas and measure burn severity. Delineating the area affected by fire in forest and scrubland on the urban fringe can be done using this method.
“The real value of open satellite data for an institution is that the same area can be monitored over the years, with the same method and without paying a licence fee.”
The limitations of open satellite data
While open satellite data is a powerful foundation for urban analysis, some limitations need to be understood for the results to be interpreted correctly. These limitations determine which decisions the data can support on its own and for which ones additional data will be needed.
- Cloud cover: Sentinel-2 and Landsat are optical sensors and cannot see beneath clouds. USGS states that the surface temperature product has a known error linked to cloud and cloud shadow, and that night-time images cannot be processed into this product.
- Resolution: 10- and 30-metre pixels are not sufficient to distinguish individual structures, narrow streets and small parks; the pixel size in thermal data is 100 metres.
- Radar in urban areas: UN-SPIDER states that flood detection in urban areas is difficult, and that smooth surfaces such as roads and sand, together with terrain shadow, can lead to false results.
- Timing: because of the revisit frequency, the most intense moment of an event may not be captured in an image; the acquisition date of the image must be recorded in every analysis.
- Ground truthing: a result derived from satellite data is an indicator; decisions that will give rise to an administrative act, such as zoning, permitting or damage assessment, require field verification and comparison with institutional records.
Preparing the institution to use open satellite data
Although the imagery itself is free, processing, archiving and interpreting the data and carrying out ground truthing all require the institution's own capacity. For this reason, for open satellite data to be used regularly within an institution, it is first necessary to determine which questions will be answered, for example whether green-space change or the trend of unauthorised construction is to be monitored. The interval at which the analysis will be repeated must also be decided from the outset. An annual green-space comparison can rely on cloud-free summer imagery, while rapid post-flood assessment requires radar imagery that is independent of weather conditions.
Satellite data gains meaning when assessed together with the institution's own records. When the park inventory, zoning plan, building permits and disaster records are compared with satellite results on the same map, it becomes possible to see where change has occurred and which record it conflicts with. For every analysis used in decision-making processes, the date, satellite and method of the imagery used should be recorded, and Copernicus and USGS data should be credited.
Sources
- Sentinel-2 Mission (Copernicus SentiWiki, ESA)
- Sentinel-1 Mission (Copernicus SentiWiki, ESA)
- Copernicus Data Space Ecosystem (Copernicus programme)
- Landsat 9 (USGS)
- Are Landsat data in the cloud still considered to be within the public domain? (USGS)
- Landsat Collection 2 Surface Temperature (USGS)
- Landsat Normalized Difference Vegetation Index (USGS)
- Landsat Normalized Burn Ratio (USGS)
- Recommended Practice: Flood Mapping (UN-SPIDER, United Nations)
This article has been prepared for general information purposes only and does not constitute legal, financial, technical or other professional advice. Legislative and technical information reflects the position as at the date of publication. Short extracts may be quoted provided that the source is cited and a link to the article is given; publication of the article in full or of a substantial part of it is subject to written permission. Terms of use